Are Punters Forever?
At 538, Benjamin Morris wrote kickers are forever. He presents a compelling case that kickers of all ages have been improving steadily at all distances since the 1960's.
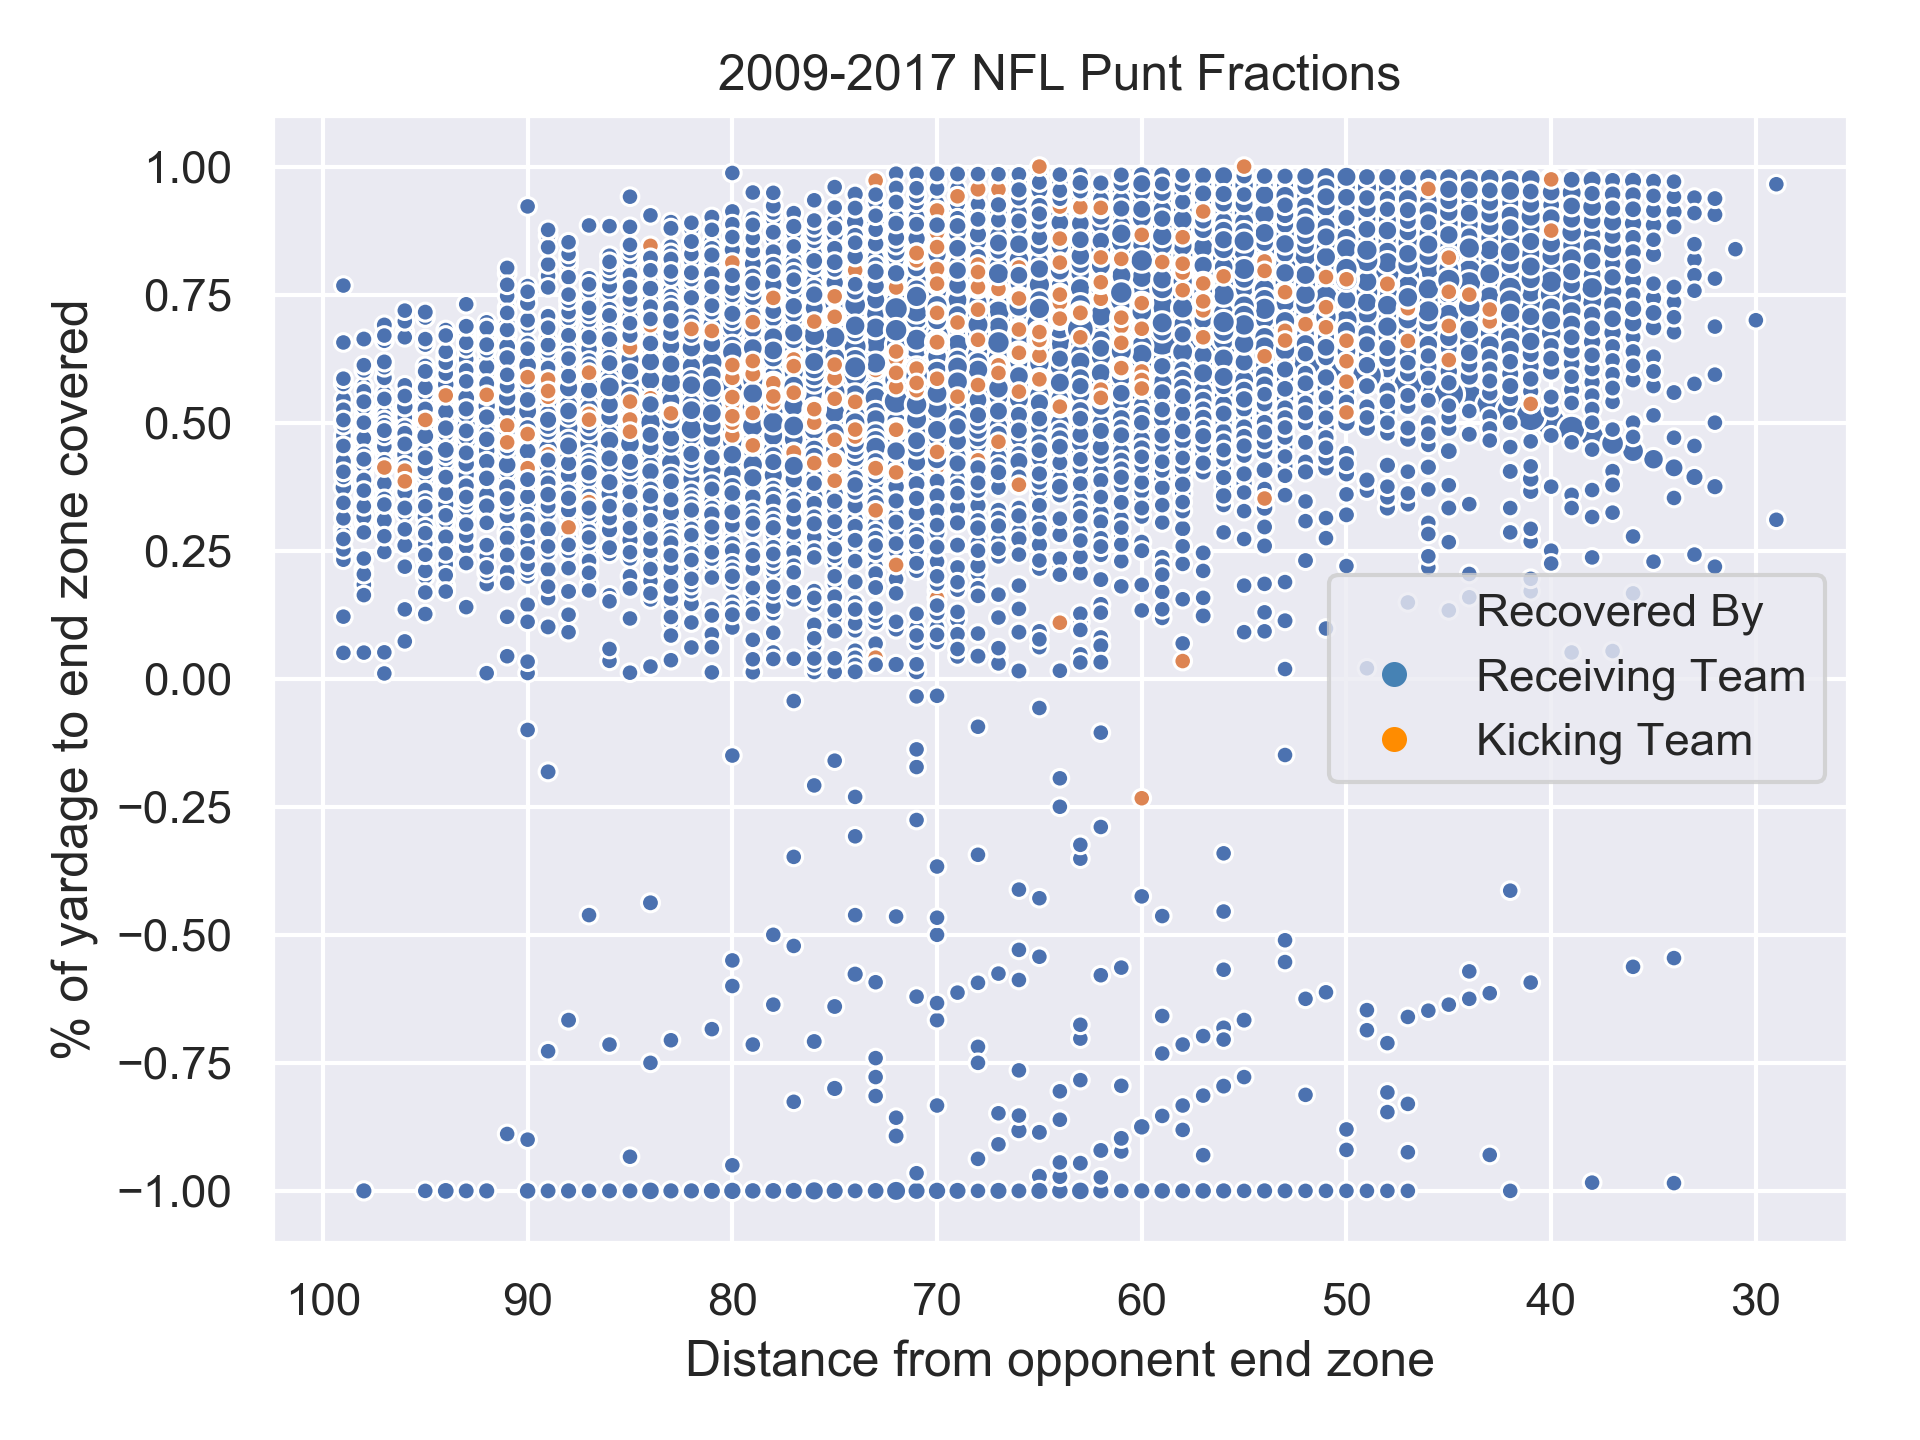
I wanted to see if punters have done the same. Using play-by-play data from 2009 to 2017, I calculated how much of the available yardage punters are eating up. An ideal punt goes out of bounds at the 1 yard line, with no chance for a return. Given that target outcome, I defined punting fraction as the percentage of available yards a punt gains for the kicking team. A kick from the 50 to the opponent's 1 gives 49 / 50, or 0.98. Notice you can have a negative punting fraction after a long return.
Yardage
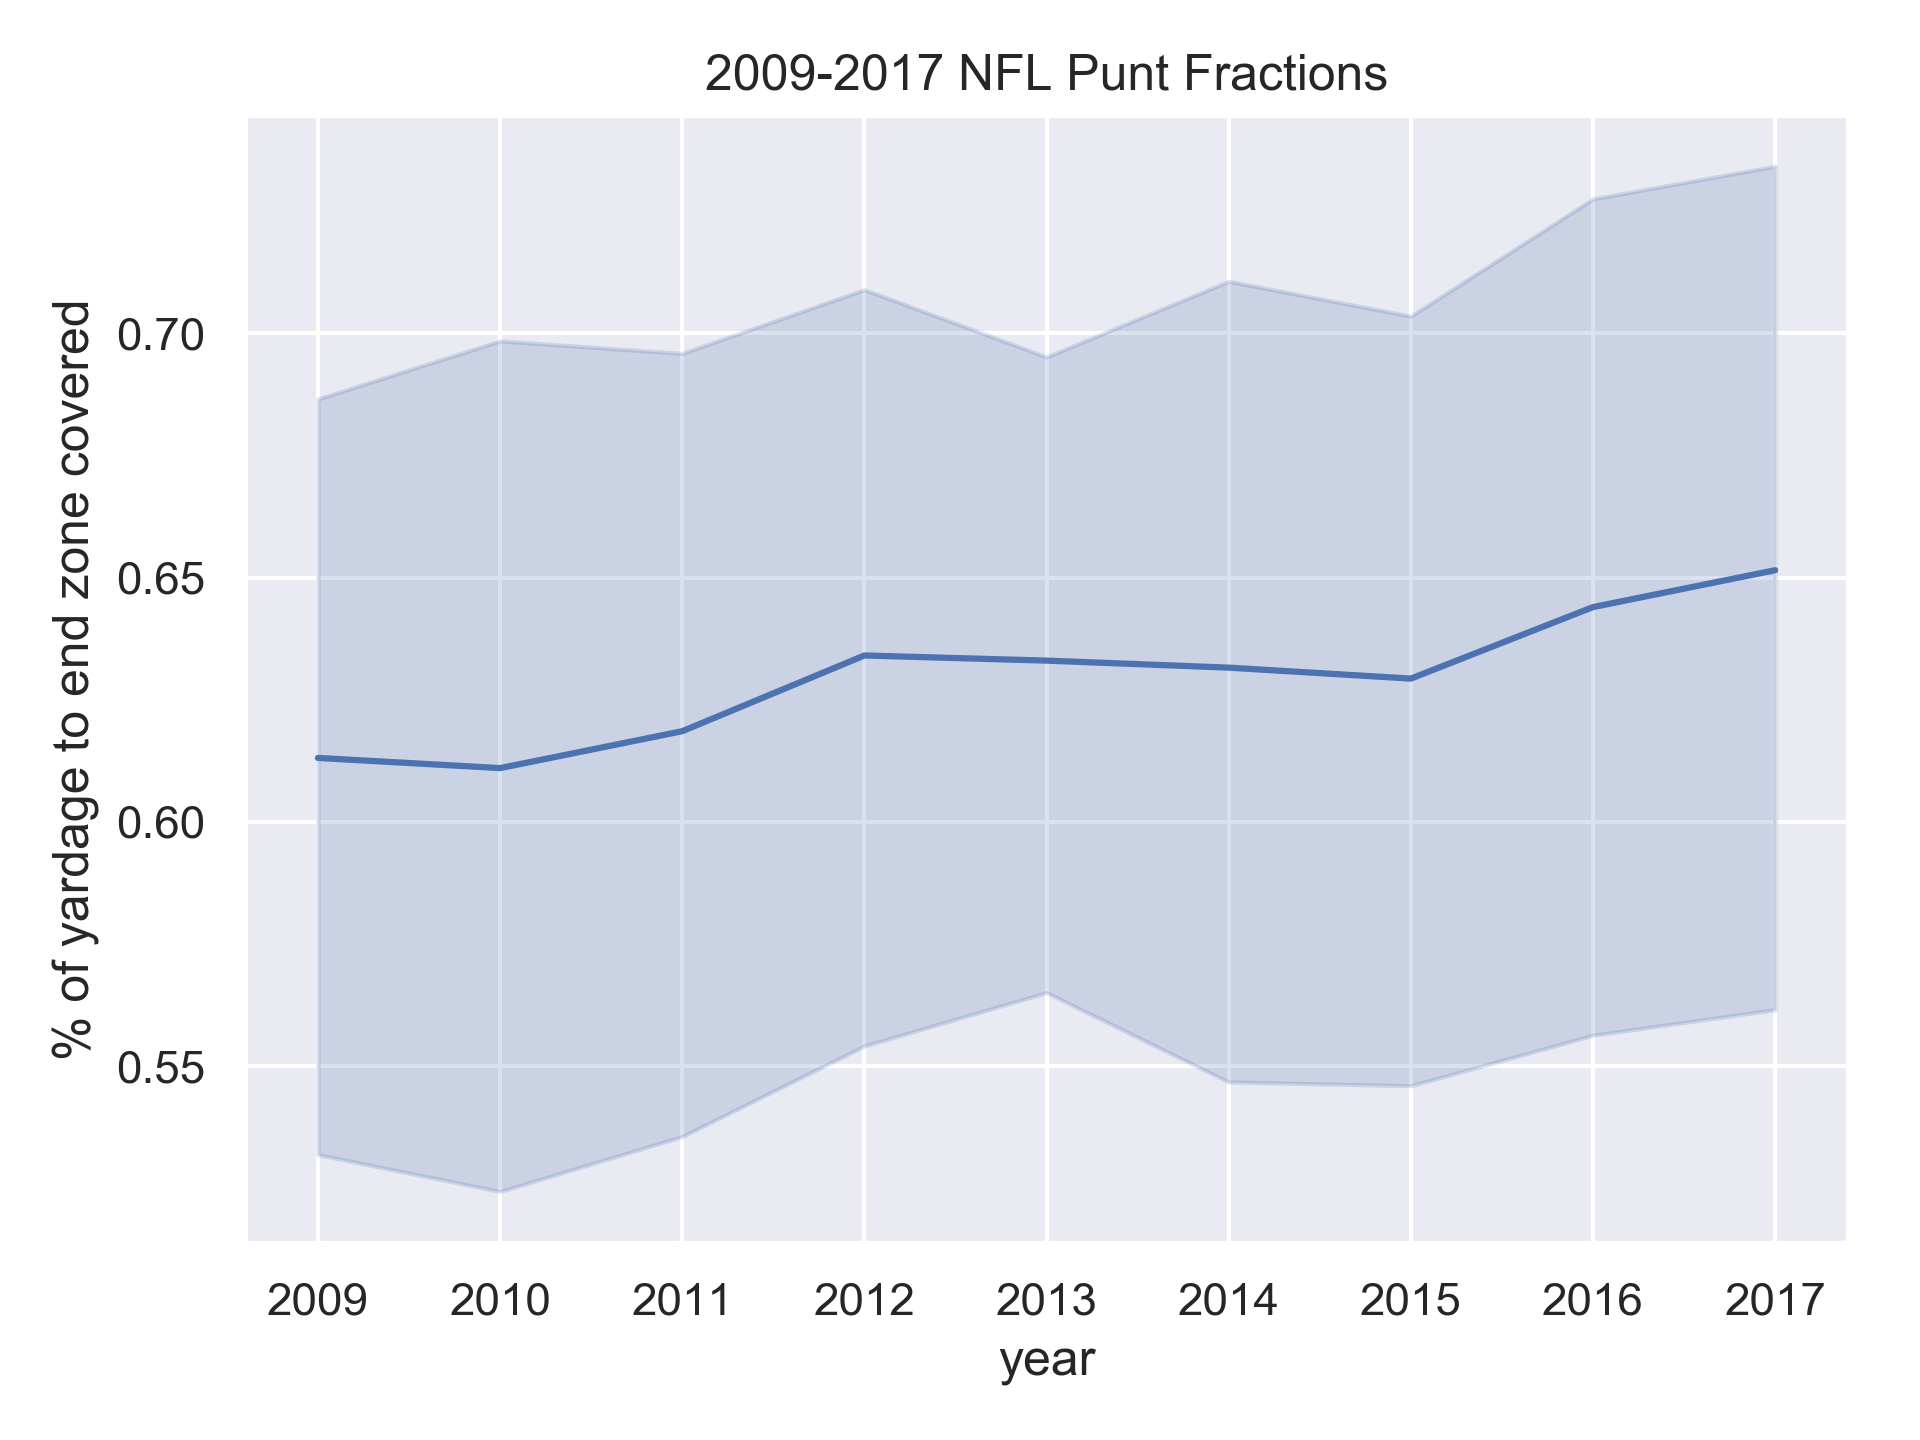
Here's what the punting fraction looks like for every year since 2009. It seems that punters are getting better - there is a modest upward trend.
Broken down by distance, it's slightly more dramatic. At virtually all ranges, the punting fraction has improved.
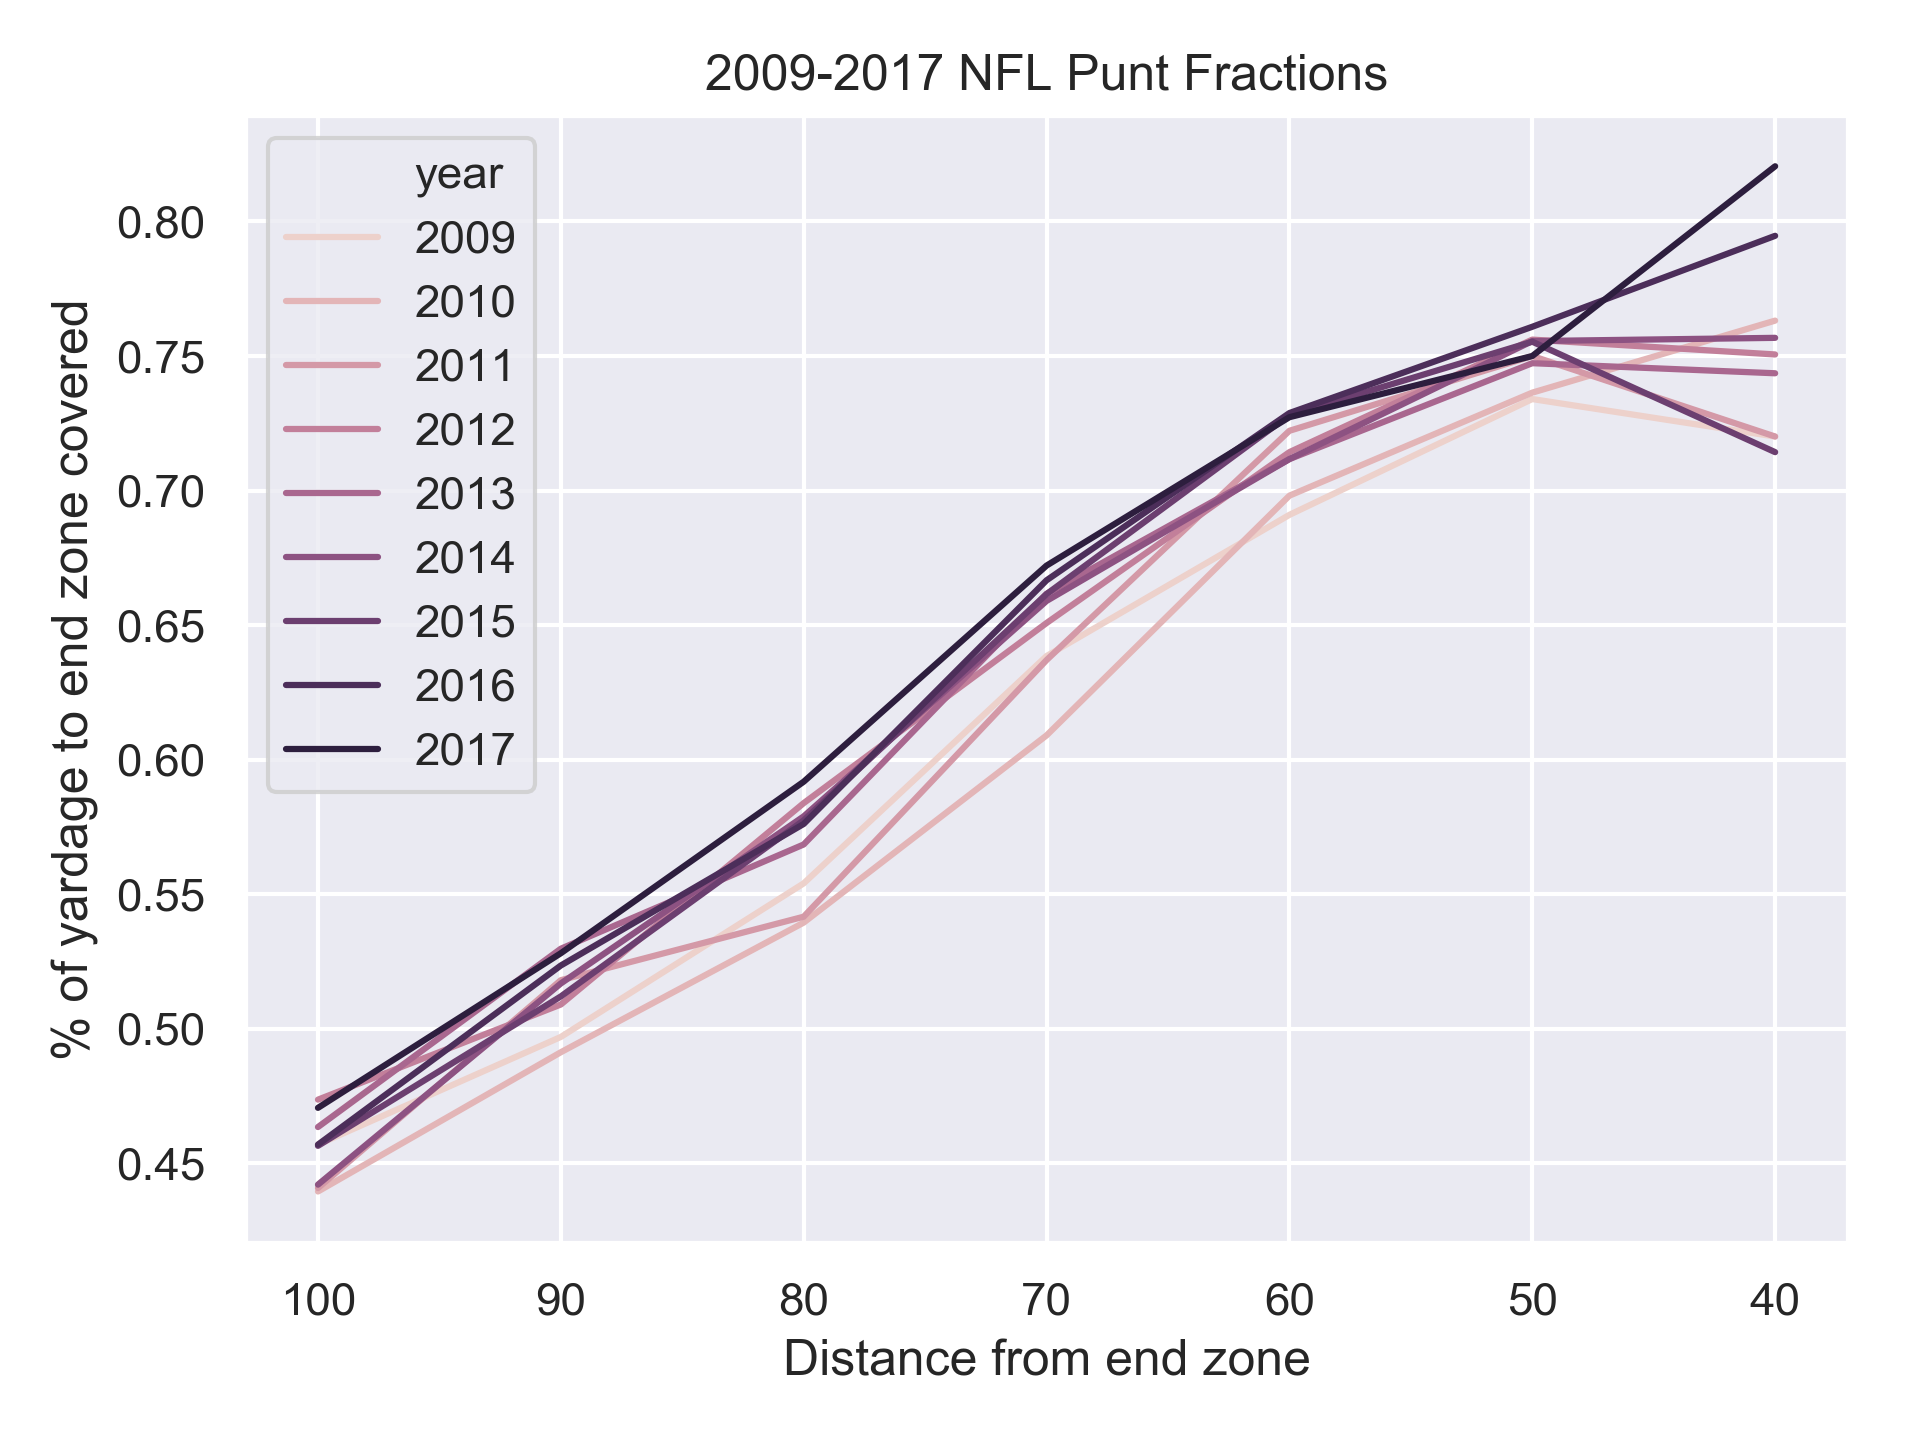
40-50 yards away is pretty noisy, but still the recent years come out on top.
Touchbacks
A touchback is a pretty bad outcome for a punter - you would rather have it come up 5 yards short instead of give up another 15. Here's the touchback rate by year:
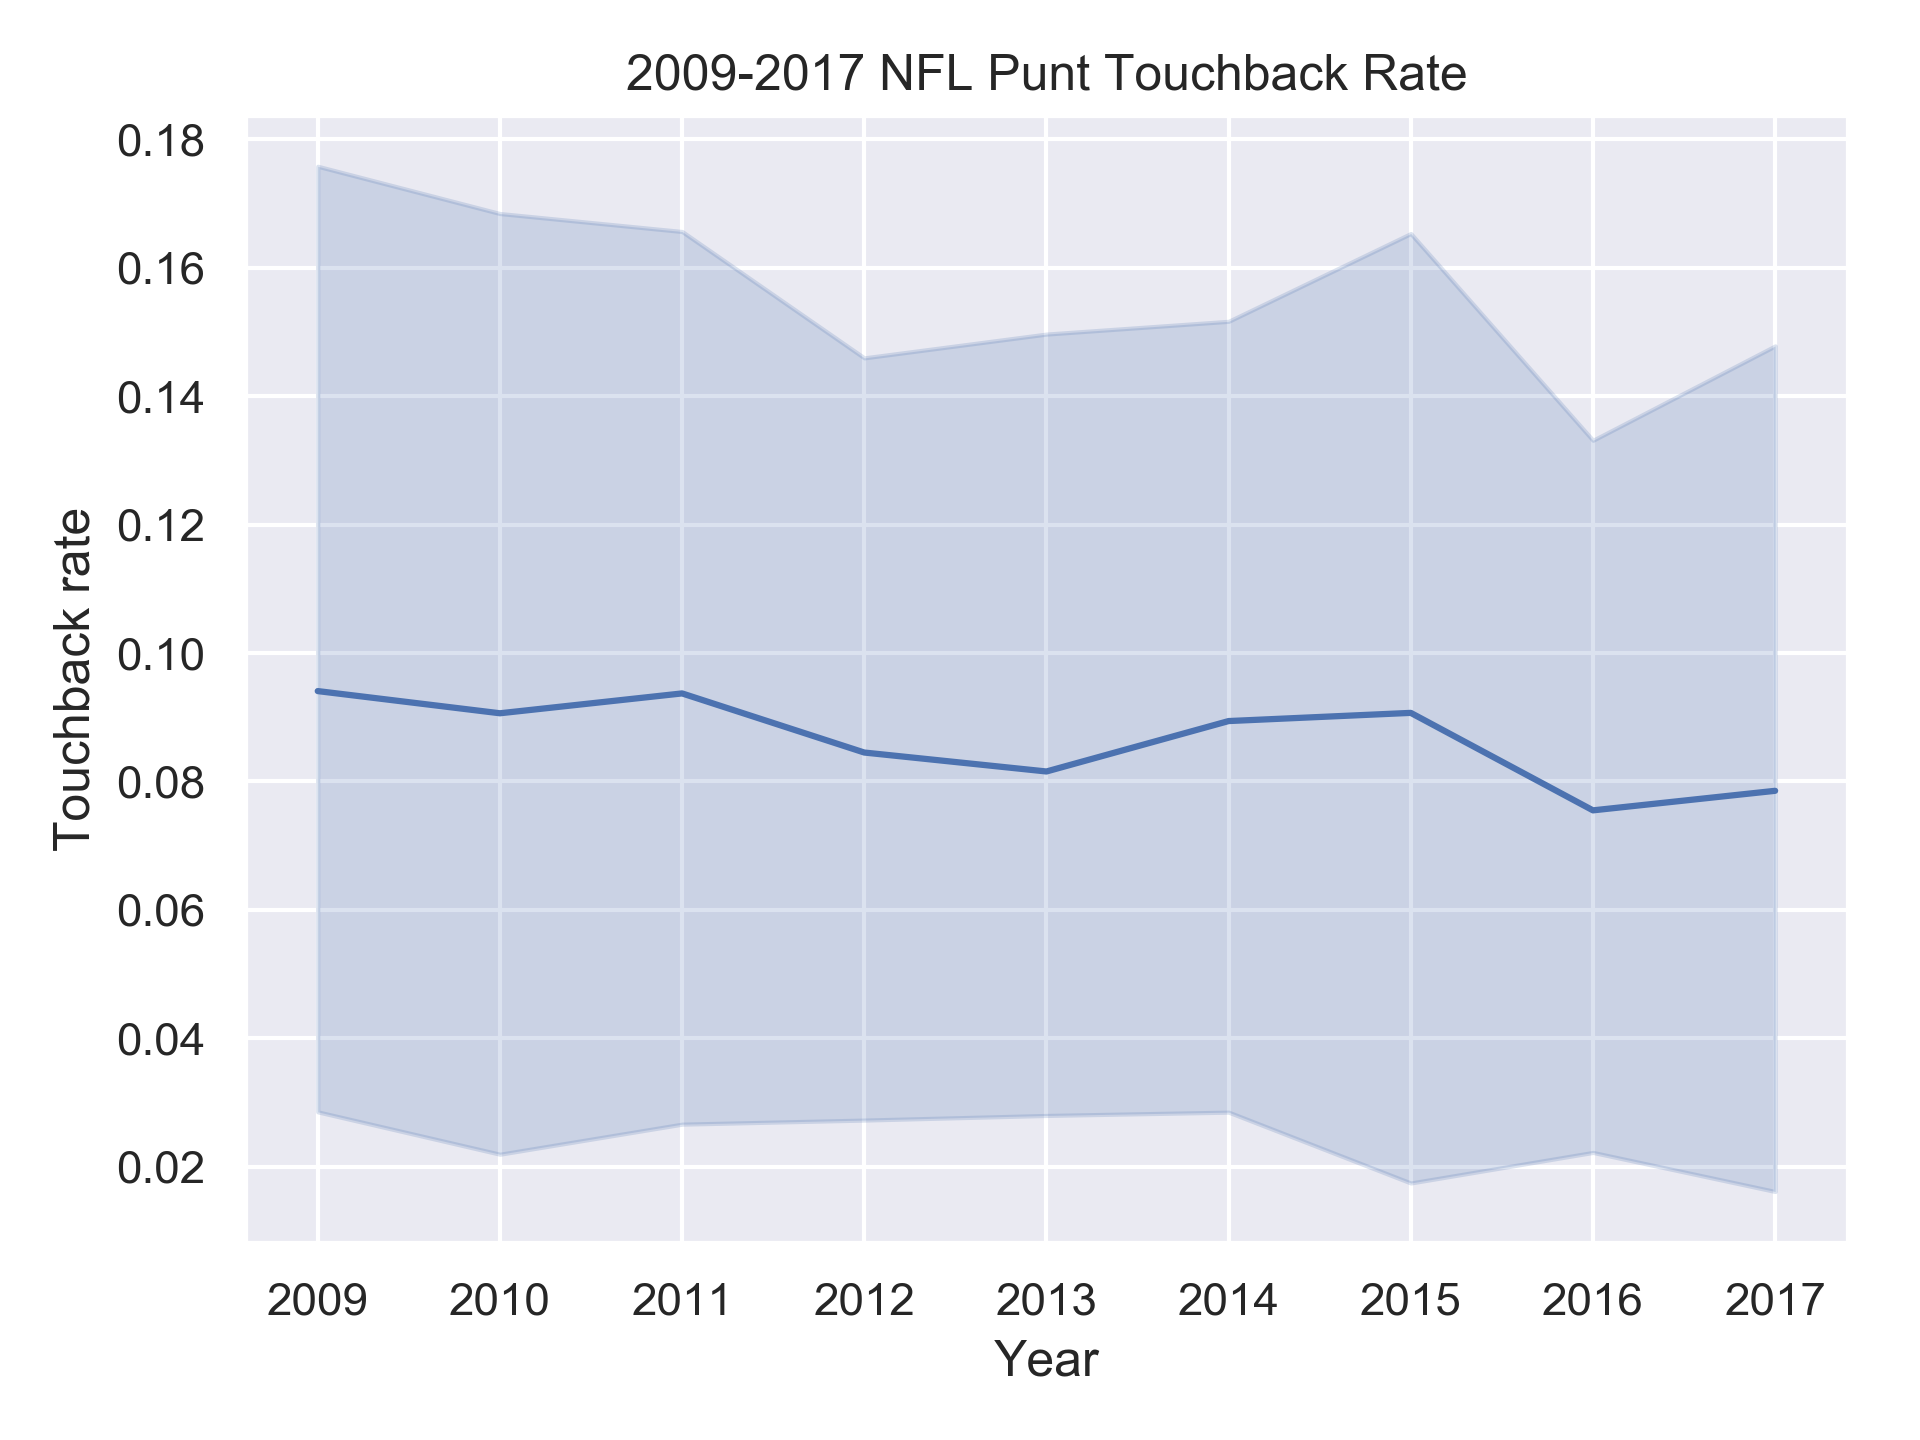
Again, a modest decrease across the board. The breakdown by distance shows similar improvement:
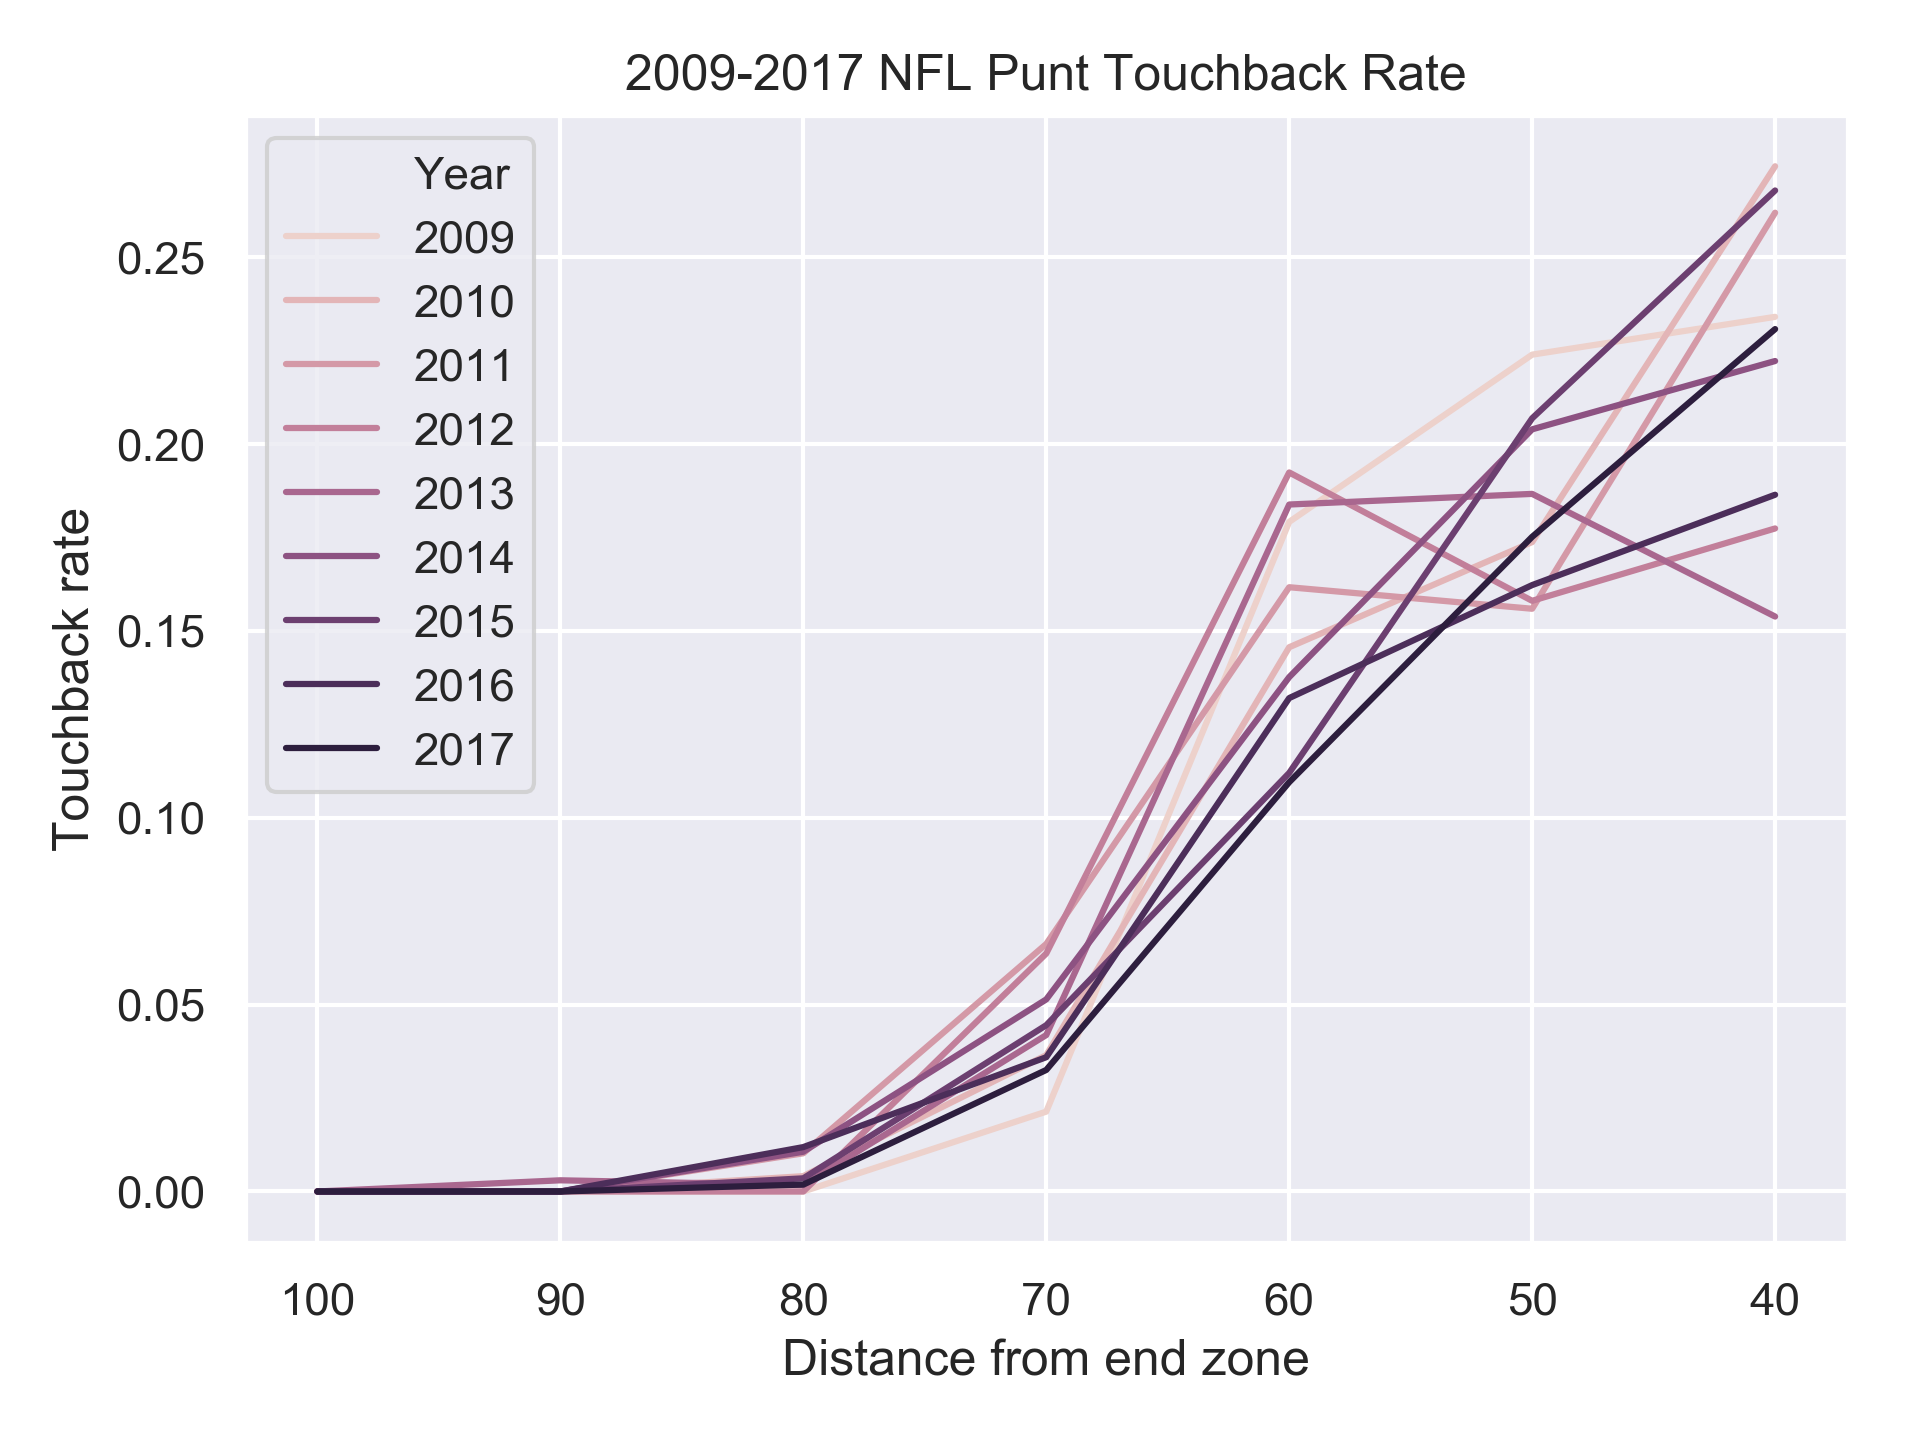
It's a noisy signal, especially once your on the short side of the 50, but the more recent years fall to the bottom of the pile.
Returns
In an ideal world, the returner fair catches the kick, or the coverage team downs the ball with no chance for a return. What does the return rate progression look like?
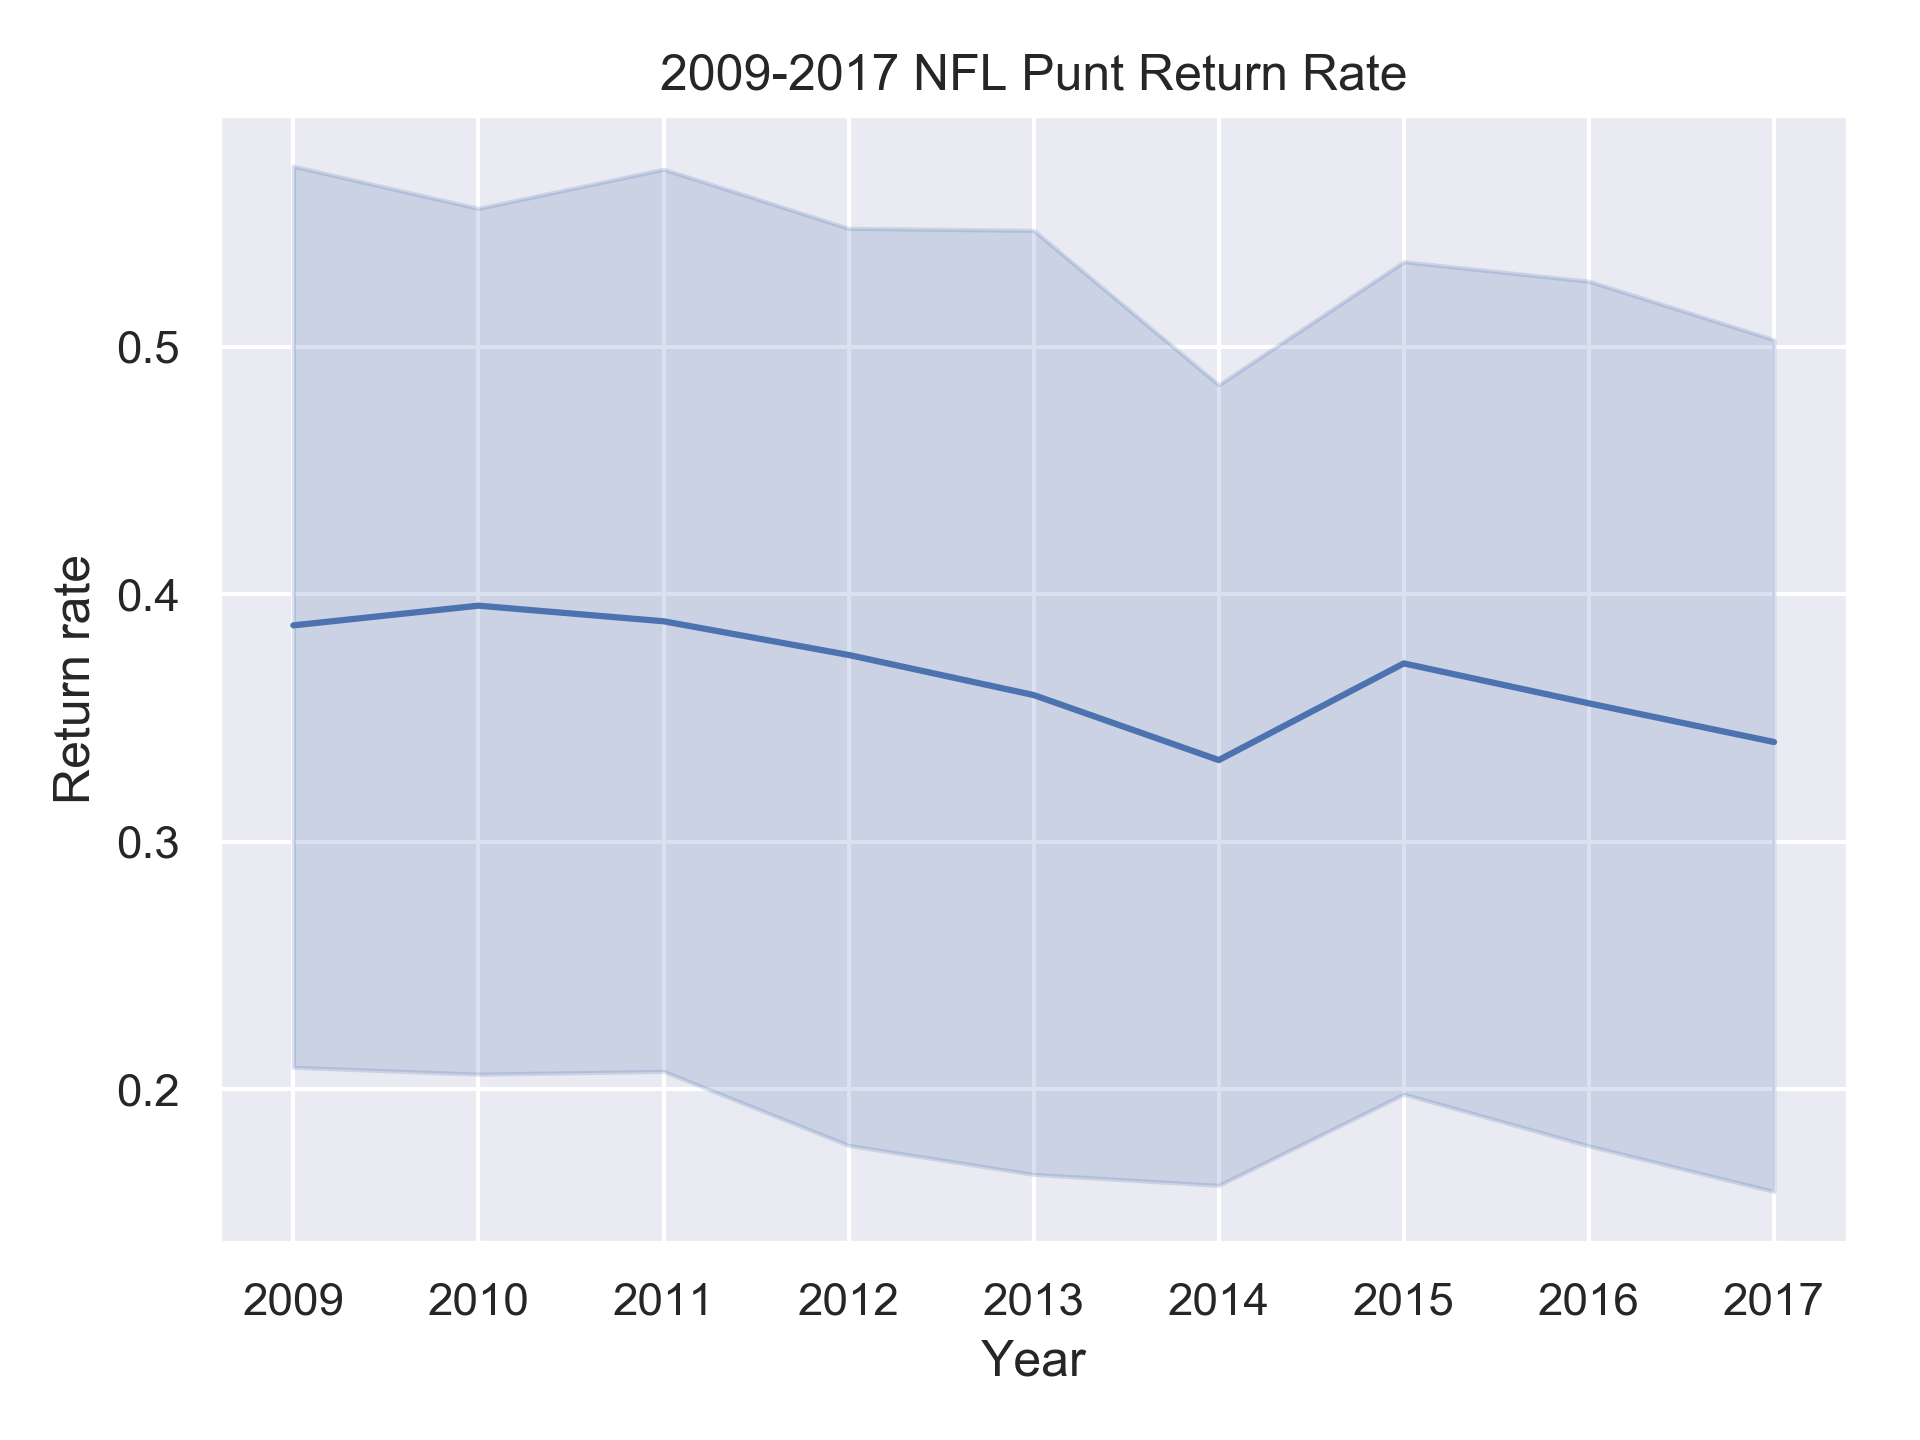
I'm not sure what caused the uptick in 2015 - I don't think there were any rules changes relevant to punt returns. The breakdown on return rate by distance:
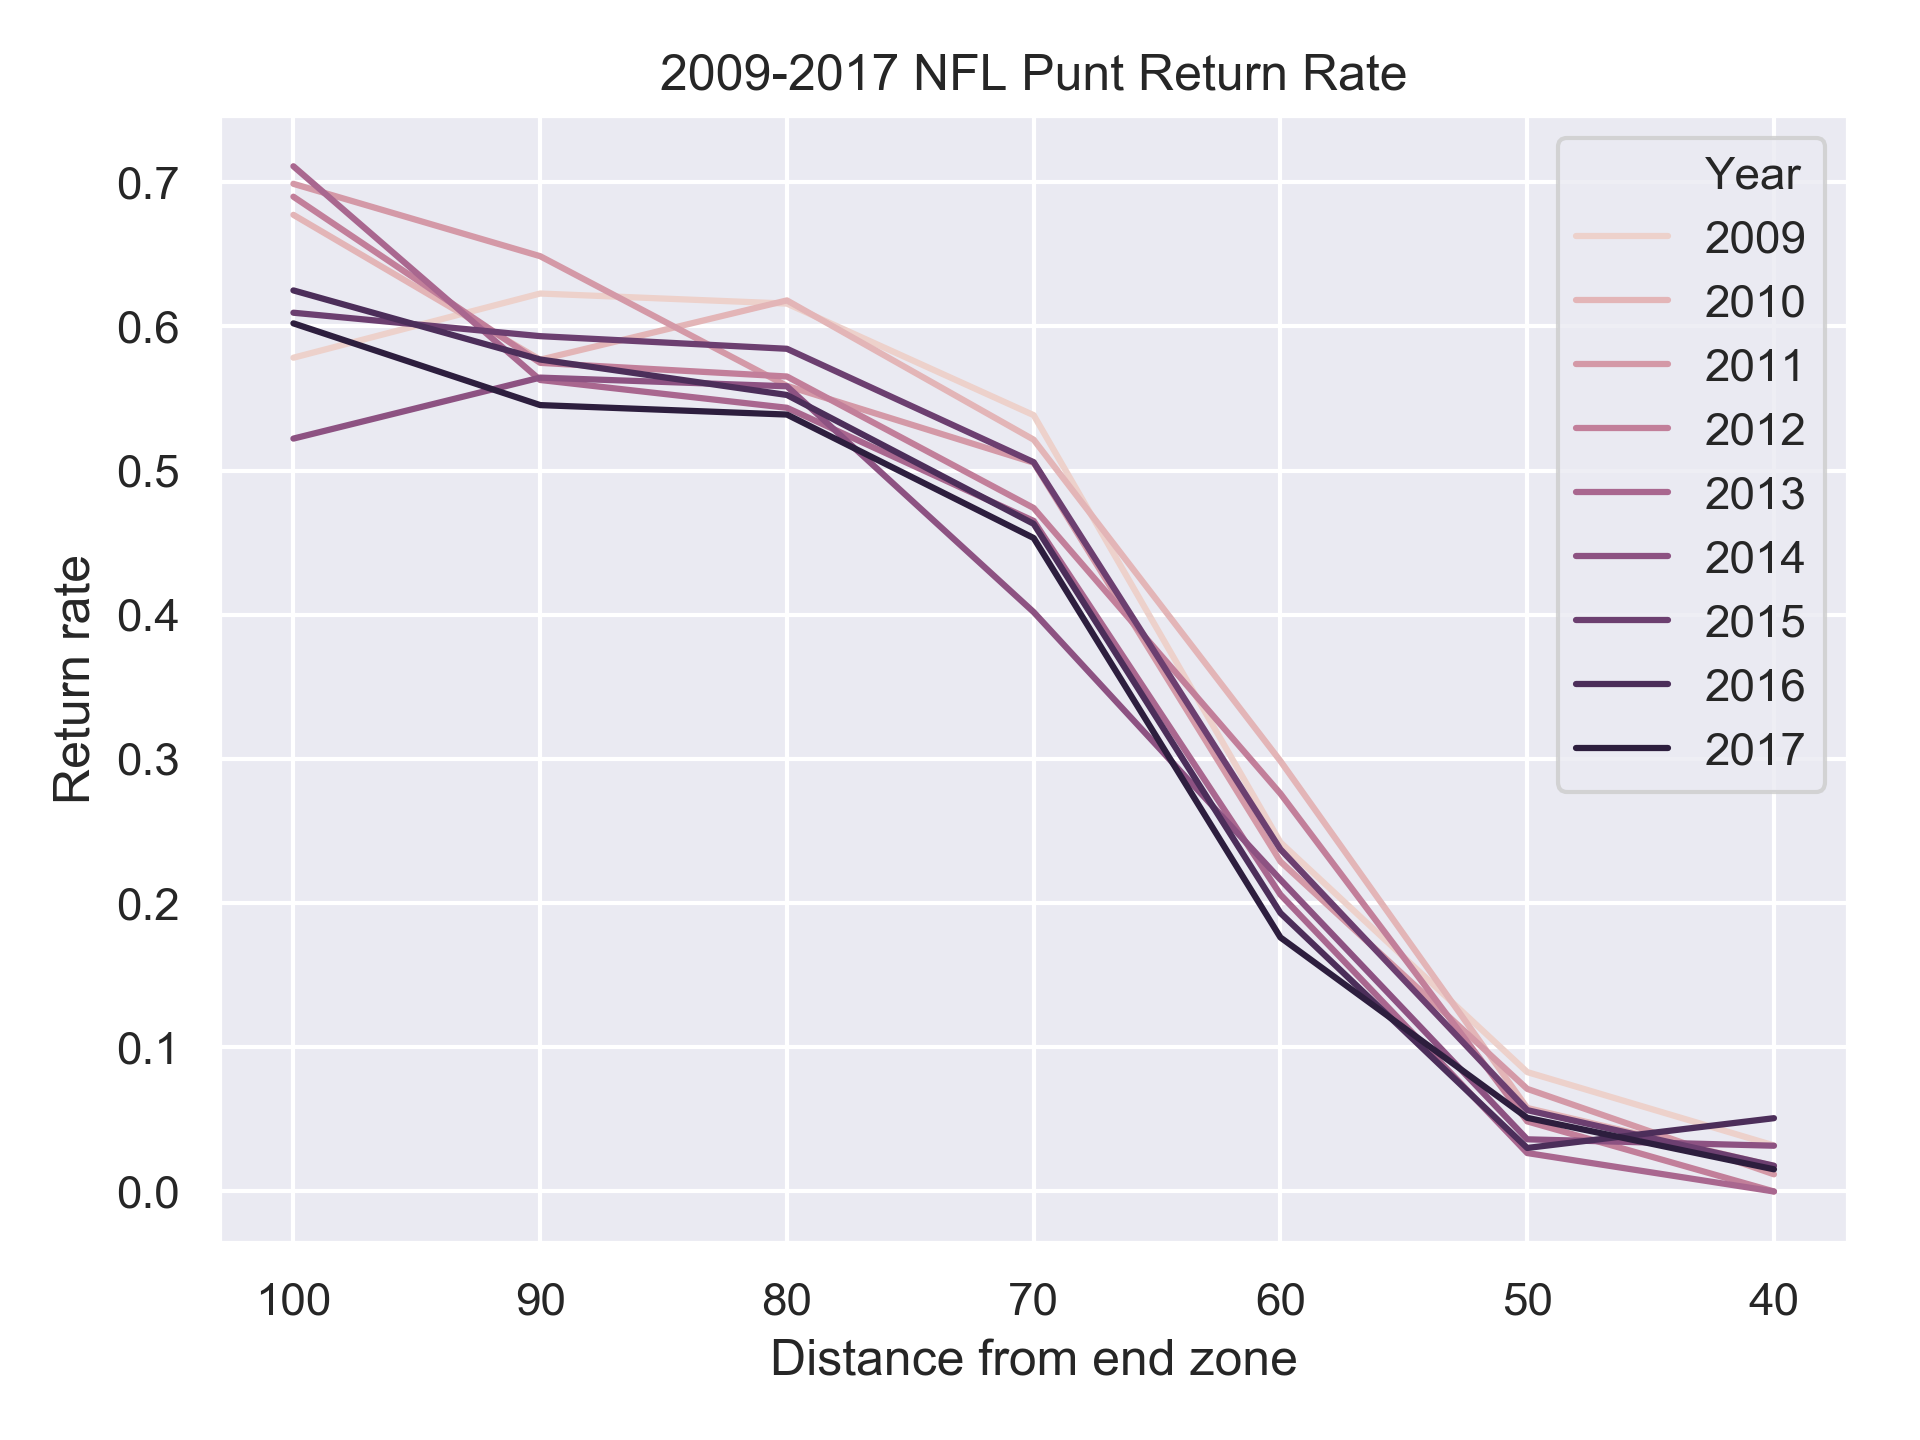
Same story, different chart. Slight improvements, at most distances. Return yardage follows an interesting path:
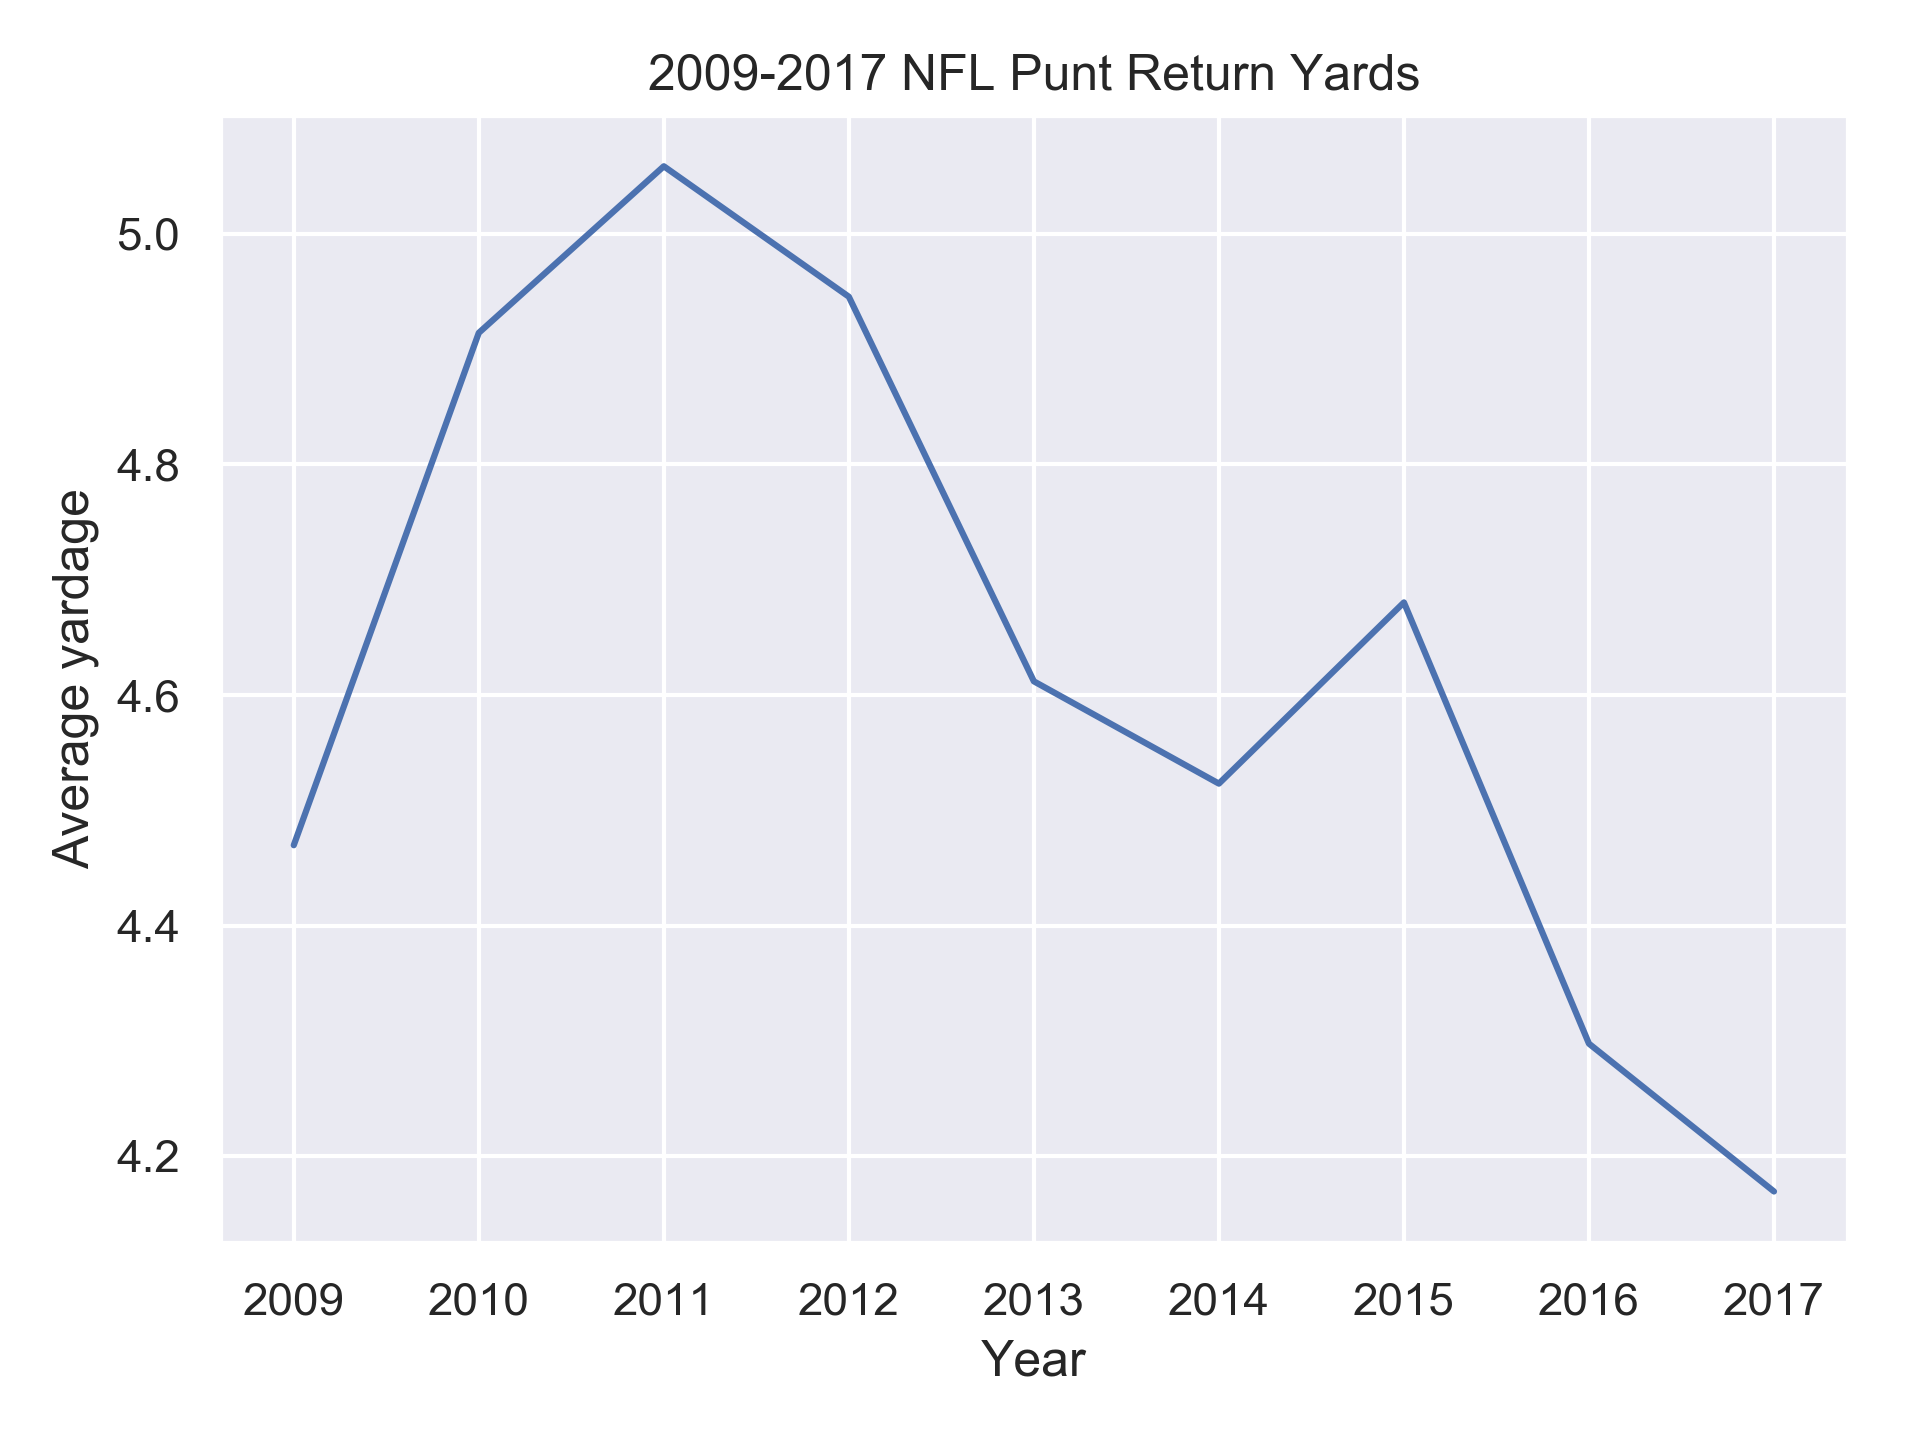
I'm not sure what caused the uptick in 2010 and 2011. The rules changes don't seem like they would affect punt returns dramatically. Since the high in 2011, return yardage is down almost 20%.
In the end, we see modest improvement across nearly all fronts - more yardage, less touchbacks, fewer and shorter returns.
I wasn't able to find any stats on hang time, I imagine that would be interesting to chart as well.
While their improvement may not be as dramatic as their kicking brethren, it looks like punters are forever too.
Here's every punt from 2009-2017. There are a lot of data points, but a couple features jump out - the touchback line, a few penalty lines as well. Also interesting that TD returns are a danger at pretty much any distance. That makes sense - once the returner has beaten all 11 would-be tacklers, they can usually run as long as they need to.
